![]()

UPDATE: Since Oct 12, my model has included more features, in addition to encounter density. XGBoost is employed for regression.
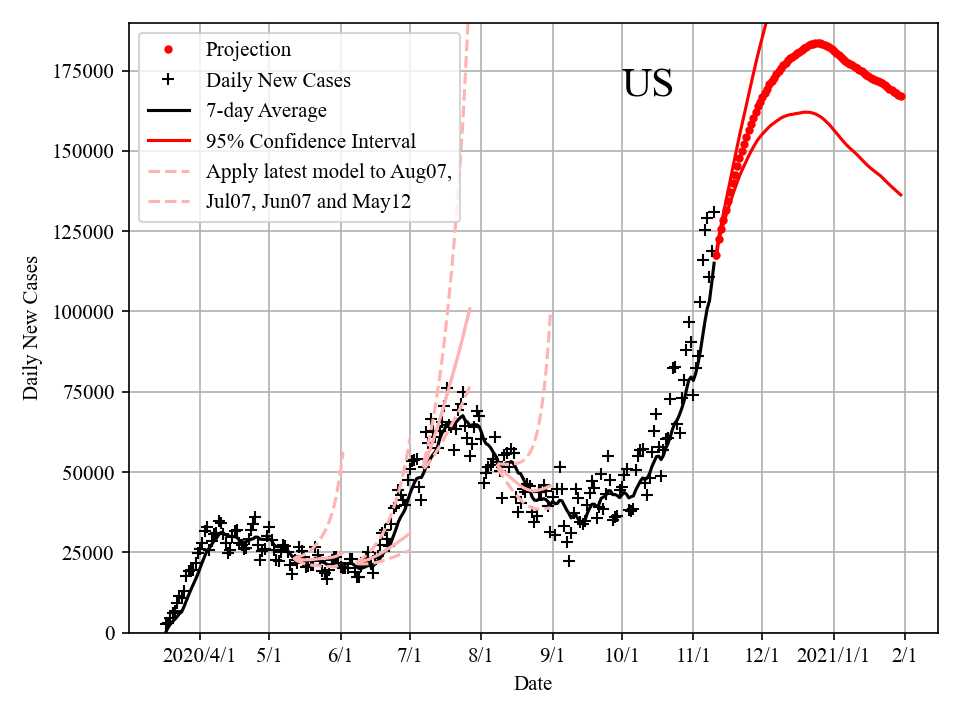
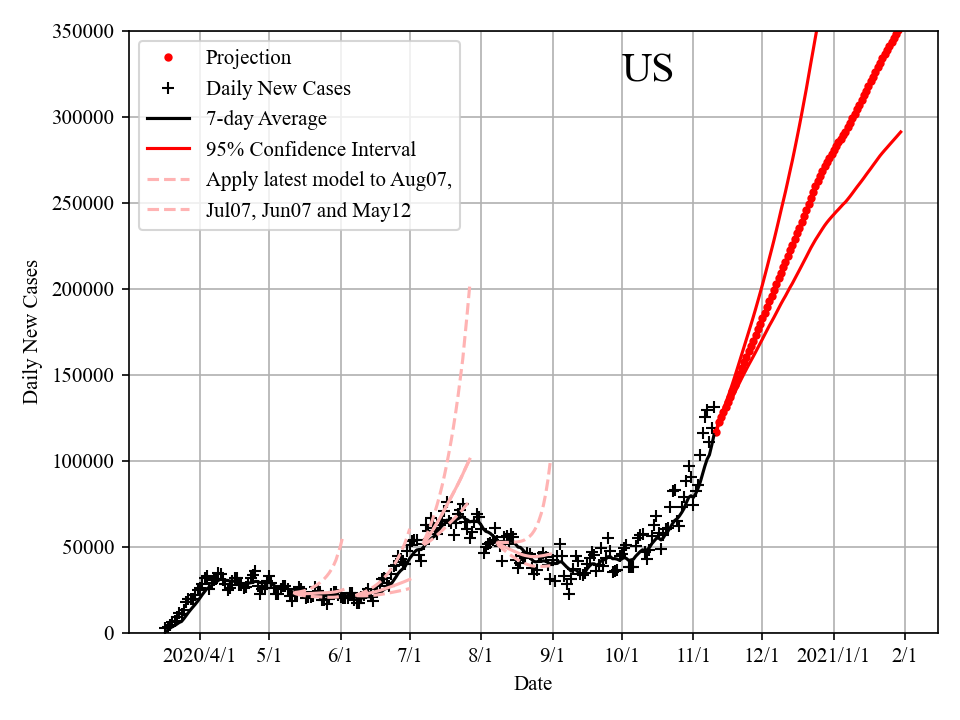
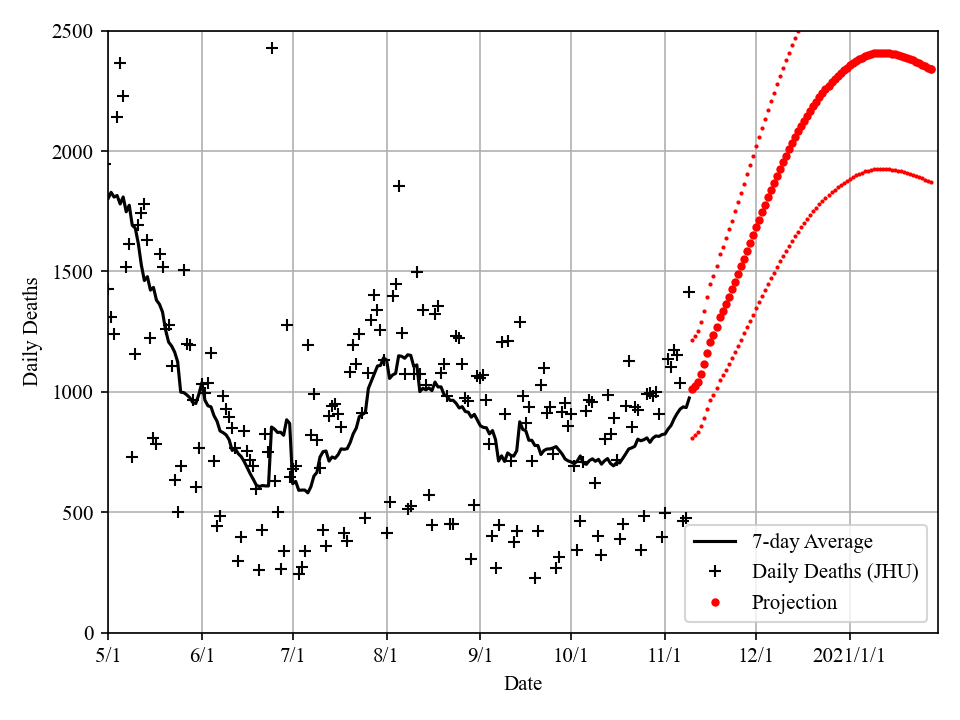
today's "Daily New Confirmed Cases" + today's "Encounter Density" ==> today's newly infected Cases ==> next 2-3 weeks' "Daily New Confirmed Cases"
(Encounter Density D data source: Unacast's Social Distancing Scoreboard, which analyzes cell phone location data, counts "Human Encounters", defined as two cell phone devices that were in the same place at the same time, and then derives the probability and "Encounter Density".)
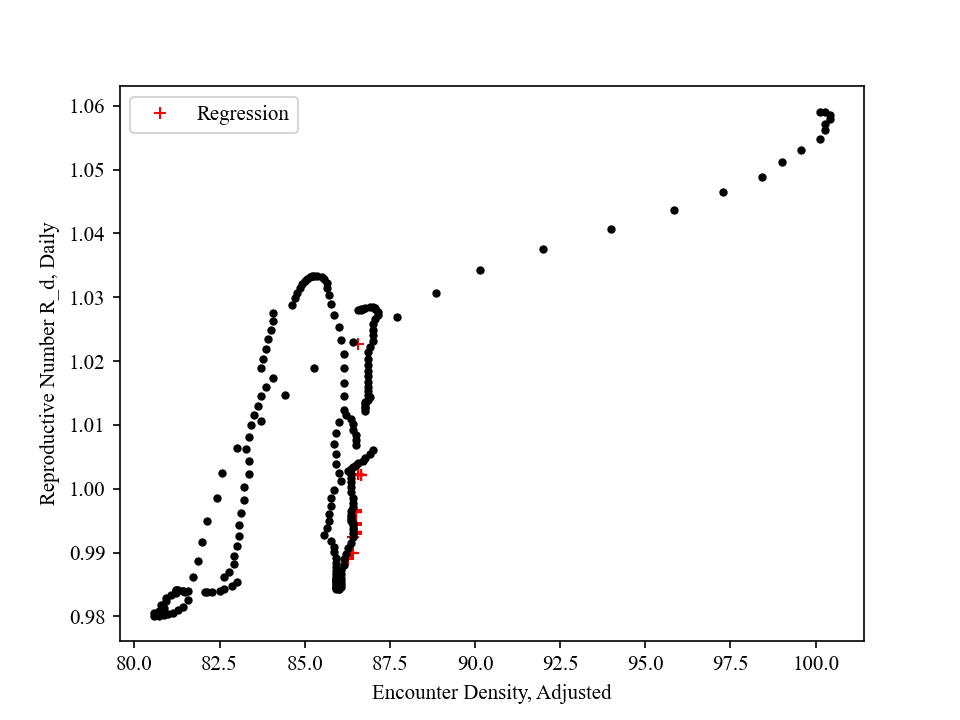
My model uses current "Encounter Density" D to predict future "Reproductive Number" R and "Daily New Confirmed Cases". This is the most fundamental idea and assumption in this model.
Daily New Confirmed Cases data is "outdated". People who get confirmed today were infected days ago through "Human Encounter" with other contagious people, and it took days to develop symptoms, seek tests, and get confirmed (infected -> symptomatic -> tested -> confirmed). In other words, today's "Daily New Confirmed Cases" is outdated data and it can be inferred from past "Daily New Confirmed Cases" data + past "Encounter" data.
Encounter data is up-to-date. Typically yesterday's Human Encounter Density data is available online today. (Encounter Density D data source: Unacast's Social Distancing Scoreboard, which analyzes cell phone location data, counts "Human Encounters", defined as two cell phone devices that were in the same place at the same time, and then derives the probability and "Encounter Density".)
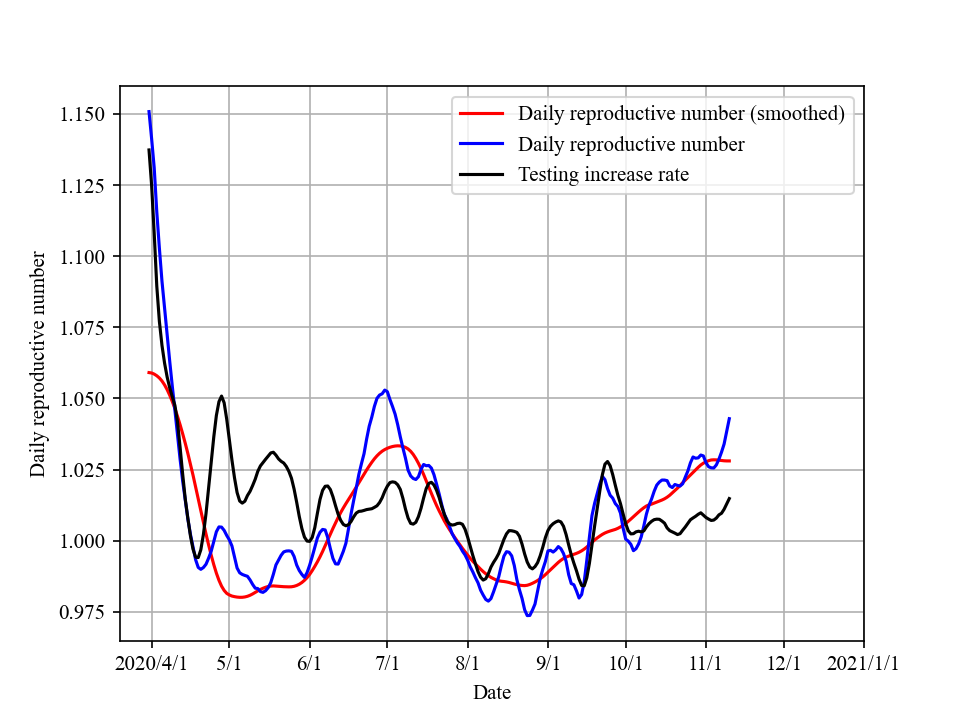
The strong correlation between R and D (D is shifted by ~22 days) is evident in this figure. While social distancing quickly brought down R, easing policy is slowly increasing R back above 1.
Using (1) R and D relation in the past as a training set, (2) future D as input, and (3) machine learning / regression, my model can predict future R, and ultimately future Daily New Cases.
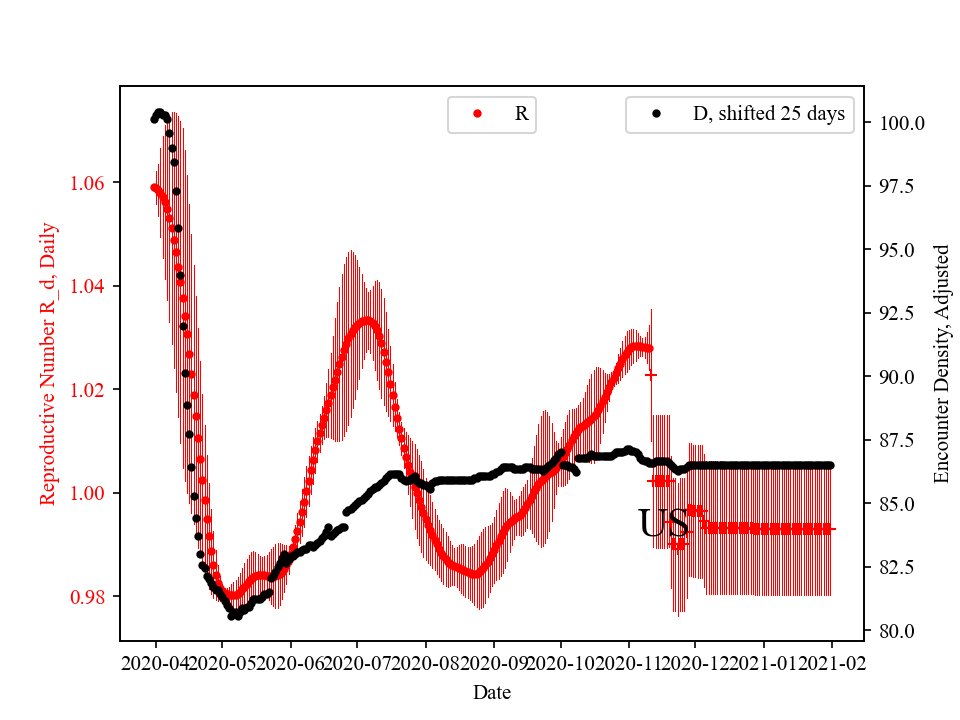
Shown in red is "Daily Reproductive Number" R_d, which is obtained through fitting of existing "Daily New Confirmed Cases". By definition, if day 1 daily new cases in N, day 2 number will be N*R_d. Hence, the ultimate goal is to keep R_d under 1.
The black dots are Adjusted Encounter Density D_adj, shifted forward by ~22 days. These two curves are remarkably close. For example, R started to quickly decrease at around 3/20. This coincides with a sudden decrease of D at the end of Feb, ~20 days before. R reached bottom at ~4/15 and stayed at the level till ~5/15. This overlaps with low D between 3/20 to 4/20. The amount of shift is optimized to maximize overlap, and the value is determined as ~22 days. The values are normalized to pre-pandamic levels, so 1.0 means activity level before pandemic hit US.